
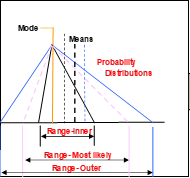
 The Automated Cost Risk Analysis Model (ACRAM)© is a proprietary, analytical, Excel-based tool that determines the risk associated with a total cost or budget estimate, given the component costs of that estimate and their individual risk profiles. All risk profiles – for the total and for each of its individual components – are expressed in terms of minimum, Mode, Mean and maximum values.
Unlike many cost analysis tools, ACRAM is able to cater for correlation between cost component pairs, so providing three risk profiles of the total cost, namely the inner and outer bounds and the most likely profile somewhere between the two.
ACRAM has been validated against Palisade Corporation’s @Risk®. It integrates with and takes advantage of the capabilities of @Risk. The unique features of the two tools now complement each other to provide a comprehensive cost risk analysis tool.
Although developed primarily for cost risk analysis, ACRAM may be used in exactly the same way for the summation of any set of linear component values (dollars, wheat yields or whatever), any or all of which may have a risk profile about the most likely value (point estimate).
ACRAM Applications
The main applications of ACRAM are budgeting, analysis of costs/prices of projects competing for funds and comparison of total costs of competing projects.
In the simplest case, management can use ACRAM to estimate the risk profile of a budget and to use that profile to adjust the nominal budget figure and to determine the most accurate contingency figures.
In analysis of costs/prices of projects competing for funds, the aim normally is to determine a point estimate for the Life Cycle Cost (LCC) of each competing project, respective risk profiles and consequent shifts in point estimates (Modes) to the Mean values.
The third application is the comparison of projects competing for funds, of which tenders are a special case. In order to know whether competing total costs are statistically equivalent or not, management needs to know how close point estimates for the totals may be and to what extent their respective risk profiles overlap. If management decides that total costs are statistically equivalent, efforts may then be concentrated on the comparison of cumulative benefits of respective projects, rather than trying to compare cost effectiveness. Where profiles overlap but not to a statistically significant extent, management may be prompted to order a more detailed cost analysis. Where profiles do not overlap, at least management will know the profile of the successful tenderer and how to best adjust the project budget and contingency provision.